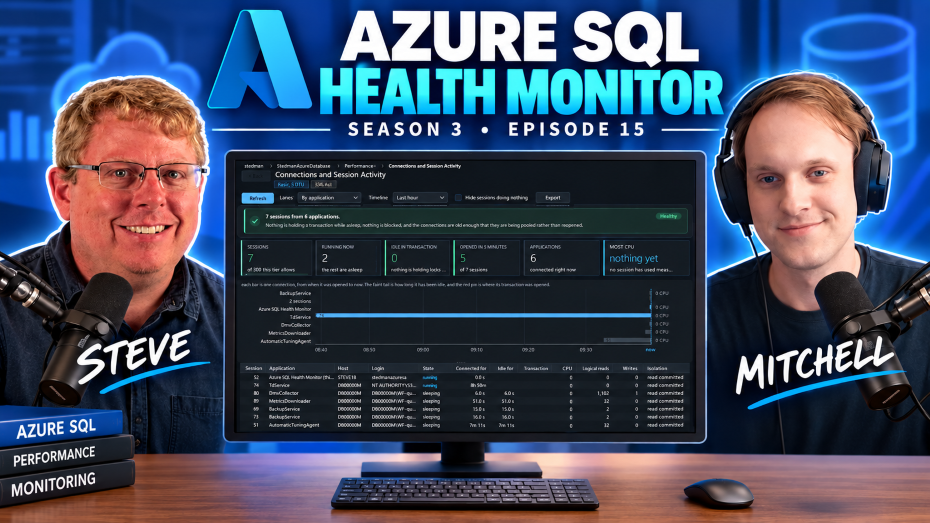
- Hosts: Steve Stedman / Mitchell Glasscock
- Topic: New Product Alert! Azure SQL Health Monitor
- Recording Date: September 2, 2026
- Listen on Spotify!
Azure SQL Health Monitor Stedman SQL Podcast Sn 3 Ep 15
Join Steve Stedman and Mitchell Glasscock for Season 3, Episode 16 of the Stedman SQL Podcast as they introduce Azure SQL Health Monitor, a powerful new addition to Database Health Monitor Version 4. Discover how to identify Azure SQL performance bottlenecks, diagnose CPU and I/O throttling, analyze slow queries, and uncover opportunities to optimize indexes and reduce cloud costs. Through a live demonstration, Steve and Mitchell explore the tool’s 60+ reports, real-time monitoring, and performance insights, showing you how to troubleshoot slow Azure SQL databases before spending more money on higher service tiers. Learn how to get started and take control of your Azure SQL performance at DatabaseHealth.com
Podcast Transcript
Steve (00:16)
All right, welcome to the Stedman SQL Podcast. This is season three, episode sixteen, and I’m your host, Steve Stedman. Today I’m joined by Mitchell Glasscock. Welcome, Mitch.
Mitch (00:27)
Hey Steve, thanks for having me.
Steve (00:29)
Yep. Mitch is from the Stedman Solutions team, and we’re here to talk about the Azure SQL Health Monitor that’s been included as part of Database Health Monitor version four. I’d also like to welcome all of our listeners, whether you’re a first-time listener or a longtime listener, welcome to the show. hopefully everybody enjoys what we have to cover today. So, given that this is the sixteenth episode of our season, this is actually our 60th episode since starting the podcast. So
Thanks everyone for joining and listening along the way. Did you catch our last episode where we covered the release of Database Health Monitor version four? Well, we’ve had some really big improvements there and some great feedback so far. People have been using terms like “wow”, “excellent”, “big improvements.” “I’m really thrilled by the latest version three, and this looks even better.” “Impressive.” And the last one, “it makes my job too easy,” are just some of the things that people are saying about the current release of Database Health Monitor version four. But this week we’re going to go talk look at our Azure SQL Health Monitor, which is included there. So if you’re using an Azure SQL database, monitoring and tracking your queries to understand what is causing the load can help you scale along the way. I mean, one of the big things that happens a lot with Azure SQL databases is they seem to slow down and then you upsize them. And it costs more money. We’re gonna dive into some things today to better understand what’s going on with that so that you can better understand your Azure SQL database.
Mitch (02:01)
Before we do that, do we wanna do a word from our sponsor?
Steve (02:04)
Yes.
(Database Health Monitor Sponsor Video)
Okay, so what exactly is the Azure SQL Health Monitor, Mitch?
Mitch (03:03)
So this is a it’s not a standalone product that we’re releasing in the Database Health Monitor suite, but it is a it’s a side-by-side program that is to supplement Database Health Monitor if you have Azure SQL databases in your environment. So if you’re hosting Azure SQL databases or using for any reason, this is the tool that you can point to say, this is what I’m using to monitor. my Azure SQL database and it gives you all the insight that Database Health Monitor can or all the insight that Database Health Monitor can’t one or the other.
Steve (03:42)
Now, one of the key things with this is if you set up Azure SQL Health Monitor, it doesn’t put anything in your Azure SQL database. It’s just reading it and providing feedback there. It’s not actually putting a monitoring database or anything like that. So that, part of it is there’s no baseline period. Like with Database Health Monitor to get some of the feedback, we have to have a baseline wait through that. but Azure collects a lot more information along the way. So this is a much quicker start to get going on in your Az your Azure SQL database there.
Mitch (04:15)
Right. With that, there is no historic monitoring as well with this, correct? Other than the what Azure hosts inside of their own database.
Steve (04:27)
Yes, so the traditional historic monitoring, as we’ve called it Database Health Monitor, no, it is not there. But a lot of similar results or similar findings can be pulled out of query store. So it’s not really needed the same way in an Azure SQL database. doesn’t mean it’s any less valuable. It just means there’s a different way we’re getting at the results that we’re finding. So one of the things that we should cover is why this is a separate product and not just a plug-in to Database Health Monitor. And with this, Azure is a different world than a than a SQL server installed on premise or even on a virtual machine in Azure. And the key difference here is that there’s no overall instance. You’re really just connecting to an Azure SQL database. Now, nothing wrong with that, it’s just a different approach. And you don’t have things like DM OS Wait stats or SQL agent, there’s no file system, things like that. Yeah, I guess with that you also don’t have to worry about things like CheckDB and backups that you manage. Those are all taken care of by the by the platform. And also the master database is not necessarily there. It’s not something we can go and read to pull information. So what there’s things that only exist on Azure that’s different because with Azure you’re looking at a service tier with hard limits. You have hard limits on CPU, data I/O, log writes, worker sessions, and size. And this is these are limits that people run into that are different than when you’re hosting on a virtual machine or running SQL Server on a physical hardware. I mean, sure, everything has limits, but these are capped at specific levels that you can just turn up the volume in order to be able to get more. course that means throwing more money at it.
Mitch (06:16)
Right. And those are the service tiers that you can get with Azure SQL databases, right?
Steve (06:20)
Yep, exactly. And when you hit one of those maxes, you end up getting throttled instead of a failure. You things just slow down rather than returning an error. And that can cause gosh a lot of chaos in an application, for instance. I mean, we have one client we’re working with where we use SQL Server replication from an on-prem server to an Azure SQL database. And it was taking literally three or four days to initialize replication on them. Well, it turned out that the instant or the Azure SQL database was not provisioned to be fast enough, large enough, high enough tier in order to be able to do that. We figured it out where the problem was, turned up the size, everything works quick now, or at least much quicker. Replication’s never quick to begin with.
Mitch (07:05)
And that’s one of the questions that Azure Database Monitor or sorry, Azure SQL Health Monitor is aimed to answer, right? It’s hey my queries are slow all of a sudden. Why are they slow? Why am I getting throttled? Why am I all of a sudden all the way at my cap?
Steve (07:25)
Yep. And what’s interesting, and we’ll show it in a minute, but I was showing a DBA just yesterday, the Azure SQL Health Monitor, and just clicking on the top level screen of information, he said to me, That’s more information than I was able to get using queries and other things in the past. So there’s a lot of information there that can help you understand what’s actually happening to it. It’s not just a database in the cloud that you don’t have any insight into.
Mitch (07:51)
We have another note, the serverless autopause. Can we get into that a little bit?
Steve (07:57)
Yeah, basically if the server is sleeping for a reason, the charts will draw that as a gap rather than a straight line across it. Now, a lot of times if you’re plotting a line chart and there’s data missing, it’s going to try and fill that in with a gap. We specifically made it clear that in the app, if the server has been paused and not active, it doesn’t just assume it’s a flat line through there. It leaves it as a gap. So yeah. Another thing that’s cool with Azure SQL databases is that the Query Store is on by default. You have query store in on-prem SQL Server, at least in most modern versions, but it’s something that’s usually not on by default. It’s a good thing to turn on quite often, but in Azure it’s always on. So that’s a great thing to have available in order to be able to find out what’s going on the database. Now, another different thing with Azure is, Azure has its own automatic tuning. And with that, storage is metered, which wasted index space is a whole lot different in a situation like that than it is on a server where you might have more storage than you need or more I/O than you need. In Azure, everything that’s all these performance items equate to how big is your bill going to be.
Mitch (09:13)
Right. So trying to squeeze a bit more performance by doing the automatic index adjustments can result in the higher bill at the end of the month, right?
Steve (09:21)
Yep. Yep. I guess one report that so we’ve got some reports in here that are very different than the regular Database Health Monitor, in that there’s a lot of things that we have a total different view of in an Azure SQL database than you do with an on-prem database. So we have reports that are very different than anything you’ve seen in Database Health Monitor in the past. Okay, so let’s jump into the demo of what’s actually included here. let me share my screen.
All right. So we have when you start up Azure SQL Health Monitor, one of the things you’ll do is you’ll choose File Connect to a Database, and just edit the connection. And it looks about like this. And with that, have you can do things like rename the server so it displays different in the application, and then you can do things to flag servers as production, staging, test, development. So it’s really clear which database is which, because sometimes with Azure with the big long server name and connect string you might lose a little bit of track of what’s actually which server is which. So with this one’s been flagged as prod. It’s already been connected, and you can see that up here. it’s showing the size. It’s a five DTU basic server. It’s one of the cheap ones just for testing purposes. And then it shows the little tag there to show that it’s a production database. I’m kind of messing with this one. It’s not really a production database, it’s a test database, but we flagged it that way just so it would stand out and you’d see.
So with this, I mentioned that I was showing this to a DBA and he said, wow, this is more information than I’ve been able to get out of all my handful of queries I use on Azure today. This one screen right here. Things you can see are the service tier is basic, the compute is five DTU, storage used, we’re at 32% of our overall storage, we’re currently at 0% CPU and 74% in the last hour data IO. We’ve got room there. And log writes, we’ve got room there as well. Then there’s six active sessions, nothing blocking. And yeah, here’s a chart down below showing CPU, data IO, and log right. And what this is going to show, if your server is under load, all of these charts and lines are going to be up near that 100%. meaning that if they’re at 100%, they’re at the top of what you’ve paid for on your service tier and compute size server.
Mitch (11:54)
So those between the CPU, the I.O., the log rights, those are gonna be the big areas to look for in reaching the max of the service tier. Or so if someone says, hey, maybe we had some slowdowns yesterday, or if we had slowdowns recently, sorry, you can look and see which one of those is starting to peak near that 100% of your service tier and start to start there as to what to look into.
Steve (12:22)
Yep, yep, exactly. And then so let’s dive into this a little bit further. Most of the charts that we show here, one of the things we always have trouble with is being able to fit the charts into the space we have. So if there’s ever a chart that looks small like this one, maybe you’re squinting your eyes a little bit, trying to figure out what the numbers or dates are, you can always click this little icon in the top right of the chart, show this chart in an overview, and it pops it up as much more detail than what you were seeing on the previous screen. So we try and do the best to show it as a summary, but popping it out and being able to display the whole thing is pretty handy there as well. So as you look through here, there’s some things you can see. And I’ve gone through ahead of time and clicked on a lot of these. So we’re showing up with different red and green, and for the colorblind, we have circles and diamonds and triangles to represent different levels here of problems. So, like if we look at I don’t know, like right here is one that’s red diamond. It’s showing that latency and service levels and the slow tail. So this is a report we don’t have any equivalent of it Database Health Monitor, it’s only in the Azure product. But what it’s showing is that if your target speed for queries is let’s say a hundred milliseconds, then 76% of all the queries being run in the server are meeting that 70 that 100 millisecond goal. And we can go look and see well, what are the queries that are not meeting that? And those are listed down below. What missed that was two queries against the update rankings object. one of them we can look here and say that it’s typically running between 125 and 200 to 250 milliseconds duration. And if we got want to go look at the query text, there it is. It is just a select top one with an outer join. and it’s ordering by new ID. That’s such a little trick we put in there to randomize things. Yeah, that’s one that’s gonna query everything and then kind of give you a random order on it. So that might be part of the reason that the top one is taking so long as it’s being randomized. but then we look at some other ones here, like we have this dupe terms. is yeah, it’s even slower than the other one running between 250 and 375, 400 milliseconds. We can look at the query text and say, yeah, I recognize this by the way, this database that we’re looking at here, test database, was about SEO optimization and different search keywords and stuff like that. So we see things like it’s going through and looking for duplicates by using a windowing clause to find partition by the term and look for duplicates and then delete something out of those duplicates. That’s one we could probably figure out ways to optimize as well. So just keep those queries in mind because those are some of them we’re probably gonna see popping up on some of these other reports here. we’ve got gosh, there’s over 60 reports, I think 64, 65 now, somewhere around there this section. But we’ve got like here’s an example showing three queries that were canceled because they timed out. And if we look at this one, we can see that this has been canceled on several times or several times along there. We can see here’s the query text of what it is. well, that’s one of the that’s an interesting one because that’s one of the queries that’s actually part of the application. And I think by being canceled, that meant that. It showed up as a canceled query because I was clicking around in the tree view over here and I clicked away before it finished loading.
Mitch (16:09)
At a high level overview, I’m seeing that there’s the performance tab and you scrolled up a little bit, there was the queries tab. Each one of those is the areas that can be throttled, right? Or areas that you risk maybe getting throttled in.
Steve (16:28)
Well, they’re more just like general categories of things that you could so if we look at storage down here, for instance, if we look at I don’t know, table hotspots, hotspots and query coupling. I mean, this is gonna show for instance, and this is one of our new charts, kind of gotta mouse over to see some of the things here, but it’s linking up tables and hotspots. So we’re looking here at the table is sear search walker search terms down at the bottom there. And it’s back to one of those similar duplicate terms type queries that we had showing in the other one. Did that answer what you’re getting at there, Mitch, or did I okay.
Mitch (17:08)
Yeah. Yeah. Well, I just kind of wanted to go over the big overview as to if you have if on the home screen chart, if you’re seeing one of those areas with more pressure, we’ve broken it out into where you can start looking. You might start in if your CPU is cranked up to 90% and stuck there or you’re bouncing off of a hundred, you might look into performance or I mean queries can also answer that question too.
Steve (17:40)
Yep. But with that, I might just go click on the CPU chart there. It drills down, drills down here with more detail. And then we can go and look at okay, if CPU is high, let’s go look at top resource consuming queries. Okay, so from here we’re seeing one query accounts for 32% of the database’s CPU time. That’s I think that gets back to your question. So if we’re at the point that we’re getting squeezed on CPU and we’re looking at, okay, well, let’s spend some money and upgrade this to the next tier for more CPU. Well, maybe it would be smarter to come in and say, well, I can get a 32% or close to a 32% boost if I figure out what’s wrong with this one query. Let’s go look at the query text. Well, and this is a little bit skewed. This is a one of the queries in the report here because we’re coming at this from the approach that there’s no real activity on this server. We shouldn’t put some artificial load on it first.
Mitch (18:41)
Yes.
Steve (18:44)
But like here, you can see the dupe terms query that we saw popping up earlier. I mean, it’s where is it ranked? It’s update rankings here. Yeah, there’s some stuff going on there, and then I don’t know. Let’s just click through a few of these. plan choice and time lost slower plans. What this is looking at is for queries that have been run over time. Well, and they end up with different plans at different points for some reason, like after a recompile, but there’s nothing showing up there. query consistency and parameter sensitivity. This is one where it’s looking at like how stable is a query’s runtime. With different parameters being passed to it. We always talk about parameter sniffing, right? Things like that, where a plan, a query, or procedure will get compiled with one set of plans and then, sorry, with one set of parameters, and then you’ll pass it in different parameters and it’ll behave very differently. So these might be some ones, some of these that we’d want to look at. Well, why are they behaving differently? And from there. we can look at weights by query and we’re looking at here of the weights that we’re seeing, the top weights are CPU related. And when we look here, it gives us a what this means column. It’s waiting for a processor to become free.
Mitch (20:17)
So we’ve kind of gone over the resources as far as like CPU or how queries might be affecting that weights and whatnot. But we earlier we went over indexes and storage and how that can affect how much a SQL Azure database costs. Can we kind of jump into that a little bit?
Steve (20:45)
Yeah, I mean one of the things you were looking at it is storage. table storage and index overhead. I mean, this isn’t a big database, but we can go look and see that table by table, this is how big they are. And just like in Database Health Monitor, when we’re looking at different features, different sorry, different growth issues on database, we usually run into like one or two tables that are a majority of the database, right? And if you’re concerned with space, it usually comes down to. Well, let’s figure out what those two biggest tables are and how can we maybe normalize them differently or take images out of them, you know, things like that. So, but we also have this is a cool one, data compression opportunities where we can look at a table and say, well, what is it doing? Is it scan heavy or is it write heavy? And how much of it is being read by scanning versus being how often is it being updated? And well, like right here, we can double click on a table and go and estimate savings. I’m going to do a smaller table because the estimate savings takes a little while to run sometimes. And hopefully it’ll go a little bit faster on the smaller table. And what it’s going to do when we hit estimate savings is it’s going to go out and do an analysis and compare different compression options, whether we’re doing row or page level compressions in order to save space. So back to your question, how do we know what do we look at for space mesh? I mean, if we’re running out of space, maybe we go and compress a few tables and gain some space back there, this one took like thirty seconds when I ran it the other day.
Mitch (22:26)
Maybe we need to upgrade our Azure SQL database tier.
Steve (22:30)
Yeah, maybe that’s the problem. But what this would come back is it would show whether it’s going to do row or pa page level compression, what the size is and what the expected size is after that compression is turned on. So we’ll close that. We’ll maybe come back with a screenshot on that later. We can look at things like indexes, there was one in here that I really like.
Mitch (22:58)
One that we use a lot in Database Health Monitor, and it also managed to carry its way over into the SQL Health Monitor or the Azure SQL Health Monitors, the unused and duplicate indexes. And this is a good one. I mean, when we’re doing overviews or we’re looking into client systems, a lot of times someone’s maybe gone on Microsoft SQL Server. They’ve gone and used database tuning advisor and thrown every index on there. And then we see a bunch of all the DTA indexes.
Mitch (23:27)
Yeah, and then we see a bunch of duplicates in there. with Azure SQL Health Monitor, I don’t I don’t know how they might recommend indexes and I don’t know if a bunch of duplicates end up in there. but this is a big space one that we’re always looking at.
Steve (23:41)
Well, here’s a report that I’ve actually been thinking about porting back over to Database Health Monitor. It’s the index usage and by query and drop risk. So part of the problem is you can look at an index that may not be used and you need to assess really, well, why is it not used and how big is it? And is it really worth dropping, right? Well, this is going to show that, like by row, it’s showing things that are using it. Sorry, by column, it’s showing what’s using it. And by row, it’s showing what’s there by size. So like this first one, search terms, it’s being used by a lot. But when we look down at like this search rankings, it’s being used by update rankings, but it’s not being used by much of anything else. So we could go through and look at all these and figure out well, are those indexes that might be worth dropping based off of the whole chart here. There was one I’m forgetting where it was. We’ve been so busy on this like this one is showing throughput and latency. It was one of them. Let me just look here. we also have shape. Or sorry, we have to have we have search here. that’s not it.
Mitch (24:53)
Another
one that I wanted to ask about is the log rate limit. That’s more of an Azure SQL term is getting rate limited with and throttled based on your log rates.
Steve (25:08)
Yeah. Yeah. So like if we go to this log write rate and throttling, it’s saying, well, it’s well within the rate ceiling. If we were at a point like the example I used where we were sending replication to an Azure SQL database, it would probably I mean doing a lot of writes would just be slamming the log. So that’s where we’re going to be able to go and see which thing is doing the most log writes, and then how can we tune that in order to be able to make things run more efficiently?
Mitch (25:37)
Right. So maybe an example outside of replication is just a an inefficient query that’s writing or making many too many updates all at once, right?
Steve (25:51)
Yeah, for sure. I have a favorite example on that. update table name set active equal one where date is older than a certain date or something like that, right? And let’s say you’ve got 10 million rows in your table, and most of the rows are older than that date and are already well, no, I said it backwards. Set active equals zero. Most of them beyond that date are already deactivated. So that’s one of them where updating a table, setting a column to zero that’s already set to zero still does a log write, still doesn’t update on the table. Whereas if you just put in a where clause to say and or on the where and that active column is already not equal to zero, then you can reduce the amount of work being done there significantly. Gosh, we had a client a couple years ago we worked on with that query, and it went from like three minutes to run to subsecond just by not updating things that are already what you intend them to be. Yeah.
Mitch (26:51)
Right. And those are the kind of
queries that in in your testing environment, you’re like, yeah, this works great. And then you throw it against your production database that may have a million or more columns or a million or more rows. And all of a sudden you’re like, I don’t know why this is slow. It’s just setting a one to a zero.
Steve (27:10)
Another one, trying to figure this is one of my favorite ones here. We don’t have this in Database Health Monitor, and it’s another one I’m considering maybe point porting over there eventually too. But query bottleneck mix tuning triage. Do you have a problem with the processor speed, with your storage speed, or with contention? and this is one of those things that we’re always looking at because if you don’t know what you’re doing with performance tuning, a lot of people look at their server and say, it’s slow. How about if I just like old SQL Server, I’ll just get a bigger, bigger server, right? For on-prem or whatever. Or here, things are slow. Well, I’m gonna crank up the from basic 5 DTU to the next size or the next size or the next size and cost you even more, right? Well, here, if you’re having a processor, if your processor is where the issue is, then maybe that’s a good idea. If you can’t tune the queries at least, right? if the storage is where your issue is, well, maybe you need to deal with how do we make the storage faster? Or how do we reduce what’s happening with the storage by looking at the queries that are stuck on storage related things? And then if contention is the issue, well then maybe that’s things like blocking and how do we figure out how to do less updates? I mean more parallelism, I mean not parallelism, but how do we get queries to run more efficiently so that they don’t block as much?
And when we look here, we can see things like we can mouse over it and say, okay, well, there’s query 994, or here’s update rankings, and then go down below and here’s update rankings. we can find the specific query and what’s going on with it. Like here’s a buffer latch issue, here’s a CPU issue. And what we’re seeing is on most of these that we’re looking at, although there are contention issues, most of them are being held up on CPU.
And if we can s figure out how to make them run faster, that will reduce the contention and the blocking. So even though it’s not saying it’s a processor issue here, it’s saying that we have contention issues because the server is just too slow overall.
Mitch (29:30)
Very cool, very cool. So another question, we’ve kind of dove into some of the reports and what are some of the more specific areas that people can look at when they get Azure SQL Health Monitor, but when they first get it, maybe they they’re getting it because they they’re they know they have a slow Azure SQL database. What are you gonna recommend the first five minutes getting into the application? What am I gonna do?
Steve (29:57)
Okay, so first five minutes, I’m just gonna start at the top and open up this main chart, see what’s red. We don’t have anything super bright red here right now. so then next thing I would do is I would just start clicking through the different charts in the tree view over here and looking at the little indicator that shows up next to it, that shows whether it’s red or orange or green or gray. The ones that are red or orange, I’m gonna look into those into more detail to see if I can understand why are they red or orange weight statistics, like right here, we’re gonna look and say, okay, things are tied to the CPU, a lot of SOS scheduler yield. Well, what you can double-click for more information there, but what can we do to go and fix that? But that’s only an orange one. I’m gonna look at like red ones down here under storage, table hotspots and query coupling. So really, I’m just looking for those things in the list over here that are red and to figure out why they’re red up front. Trying to make it just this color coded where green is good and red is bad, and in between is mediocre.
Mitch (31:10)
So you just want to answer, hey, what is that what is on fire right now? What’s that big, big problem?
Steve (31:16)
I might look at log right and rate throttling or resource usage and throttling over here as well and see what’s happening there too. I mean, these are gonna be a very different chart with real production data versus this little test database we’re mocking as production right now, right? Yeah.
Mitch (31:31)
And
so my exec is sitting over my shoulder. He sent me a very warmly worded email saying, Hey, why is this happening? I need to send over some screenshots or say maybe copy some query text out. How easy is that in this?
Steve (31:51)
Yeah, so that’s one of the things that on all the charts, and we did this in Database Health Monitor too, with a right click, but on here we’ve actually got an image where you can mouse over it, copy this chart as a picture. There you go. You’ve got it, it’s on the clipboard, you can paste it in your email. can go up here on different but you can also use the Windows screenshot tool to or the clipping tool to capture like the whole screen. but down here we can go to different areas, and maybe that’s an area. maybe the grids we could do more and paste options from, but on all the pictures, they’re definitely cop copy. if we go, let’s see, if into like a chart here, like this one, we open it up to make it bigger, and then we can maybe size it the way we want it for email. And then from here, we can either save it as a PNG or copy it out as a clipboard and paste it into the email that we need to send, or the summary report that we’re giving to the boss man or the client.
Mitch (32:45)
Very cool, very cool.
Steve (32:48)
So this is something we’ve been working on for a little bit. There’s a whole lot that has gone into it. And it’s there, it’s part of Database Health Monitor now. And everyone who has a license to Database Health Monitor also gets a license to this. if you have the free 30-day trial of Database Health Monitor, you get full access to this as well. and then we have a promo going where anyone who’s ever had a trial of Database Health Monitor in the past that might have expired, that’s going through October thirty first of twenty six that your trial has been extended for that amount of time. So lots of lots of access there for people who want to try it out and check it out.
Mitch (33:32)
And correct me if I’m wrong, but there’s no minimum access level. We don’t require you to pay or purchase the ten instance limit for this, correct?
Steve (33:43)
Right. So right now this would apply towards your instance count. So if you had ten instances, you’d be able to connect to ten Azure SQL servers as well.
Mitch (33:55)
But if you’re only running one Azure SQL database, you can get the one instance monthly or yearly for a very low cost and get this program.
Steve (34:04)
Absolutely. Yes. Yep. And then the other thing is if you do have it connected to multiple Azure SQL servers, what it’s going to do is show a panel here with each of them listed and you’d be able to go and get a better idea of which one needs attention as well.
Mitch (34:19)
Very cool.
Steve (34:20)
All right. I kinda got off track on our agenda or plan here, Mitch, but is there anything else we want to cover before we get to kind of the wrap up on it?
Mitch (34:31)
No, I think that kind of covered a lot of the questions I had. I know the there’s so many reports that it’s hard to show each of them in in a timely manner on one podcast. but I guess it kind of opens the door. If you’re running an Azure SQL database and you’re running into performance problems, you can get this program. But hey, even if you if you’re not sure where to start or you really want some help, you can always contact us and we’re more than happy to jump on and go over what you’re seeing and maybe make some performance recommendations as well.
Steve (35:10)
Yep. And you know, there’s a couple of ways we can do that too, because we have our mentoring package where you can just buy it four hours and then use that over time and we help you as needed. or we can help you with like a full performance assessment or things like that. Help you figure out how your server can run faster. And we have our managed services too, that helps in that area. So
Mitch (35:31)
Sure. But if you have performance problems, reach out. We’re more than happy to help. That’s the that’s the big one. We always want to help out.
Steve (35:37)
Yep. All right. So just a quick summary on what we’ve covered here is that yeah, Azure is a very different thing. Azure SQL databases are a very different thing than on-prem or virtual machine hosted SQL Server. what we’ve got here will help you diagnose and understand what’s going on with performance there. And if you want to try it out, download it and point it to your Azure SQL database and walk through and see what you’re going to find in there.
If you want to download it, you can go to DatabaseHealth.com and click on the download. And then there’s a documentation page as well. And yeah, reach out for us to us if you need help.
All right. Well, I think that wraps it up for now. Mitch, thanks for joining me today.
Mitch (36:23)
Thank you. Yeah, that was exciting.
Steve (36:24)
Yep. And don’t forget about the extended trial. So if you’ve ever tried Database Health Monitor in the past and your trial has expired, your 30-day trial, well, it’s fresh now. You got a whole 30 days to try it out again. and then everyone who signs up before October 31st gets 30 days or October 31st of 2026, whichever is later. Next week, we’re going to cover Database Health Monitor more on the version four release. Shouldn’t say next week. It’s next episode. and we’re gonna be specifically looking at instance reports and what’s been added and what’s been changed there in Database Health Monitor for the on-prem or VM-based SQL Server as opposed to Azure SQL databases. So thanks for listening. please, if you like the show, leave us a comment, subscribe and rate if you found it helpful, and have a great day.