Every engagement starts the same way. Someone opens a ticket, or picks up the phone, because a report is slow, a backup did not run, or a job failed at three in the morning and nobody noticed until the Monday meeting. The first hour of that engagement is rarely spent fixing anything. It is spent finding out what is actually true: what changed, what the server has been doing for the last six months, and whether the thing everyone assumes is the cause is the actual cause. Version 4.1540 of Database Health Monitor is built around that first hour. It adds sixty three new reports, twenty five new features, and closes five hundred and fifteen tickets, and almost none of it is about running SQL Server faster. It is about knowing what SQL Server has actually been doing, on every instance a team is responsible for, before the next call comes in.
The scale of this release, at a glance
This is a large release by any measure, and the shape of it says as much as the totals. Sixty three new report pages arrived this cycle: twenty five in a new Query Store suite, fifteen covering SQL Server Reporting Services, and twenty three added to Azure SQL Health Monitor for plan, workload, capacity and storage questions that platform as a service databases raise on their own. Twenty five new features touched connections, everyday use of the product, backup and restore, Quick Scan, and the reporting and tooling menus. Five hundred and fifteen bug fixes closed, most of them not crashes, but behavior that was quietly wrong: a page measuring time on the wrong clock, a script that would not run on a table name with a bracket in it, a grid whose verdict column sat off the edge of the screen at a resolution somebody actually uses.
That last category is worth pausing on, because it is the one a consulting practice feels first. A crash is obvious, and it gets reported the same day. A wrong answer that still looks plausible is the expensive one, because nobody double checks a number that looks reasonable, and a decision gets made on top of it long before anyone finds out it was wrong.
Query Store and SSRS: the two blind spots every engagement finds
Twenty five reports for Query Store
Query Store has been on by default since SQL Server 2016, and almost every production instance a consultant walks into already has it turned on. What almost none of them have is somebody reading it regularly, because Query Store answers a narrow question well, what did this query used to cost, and turning that into which of the four hundred queries on this server should actually worry a team is a research project, not a report. The new suite does that research once, on a schedule, instead of leaving it for the next incident to trigger.
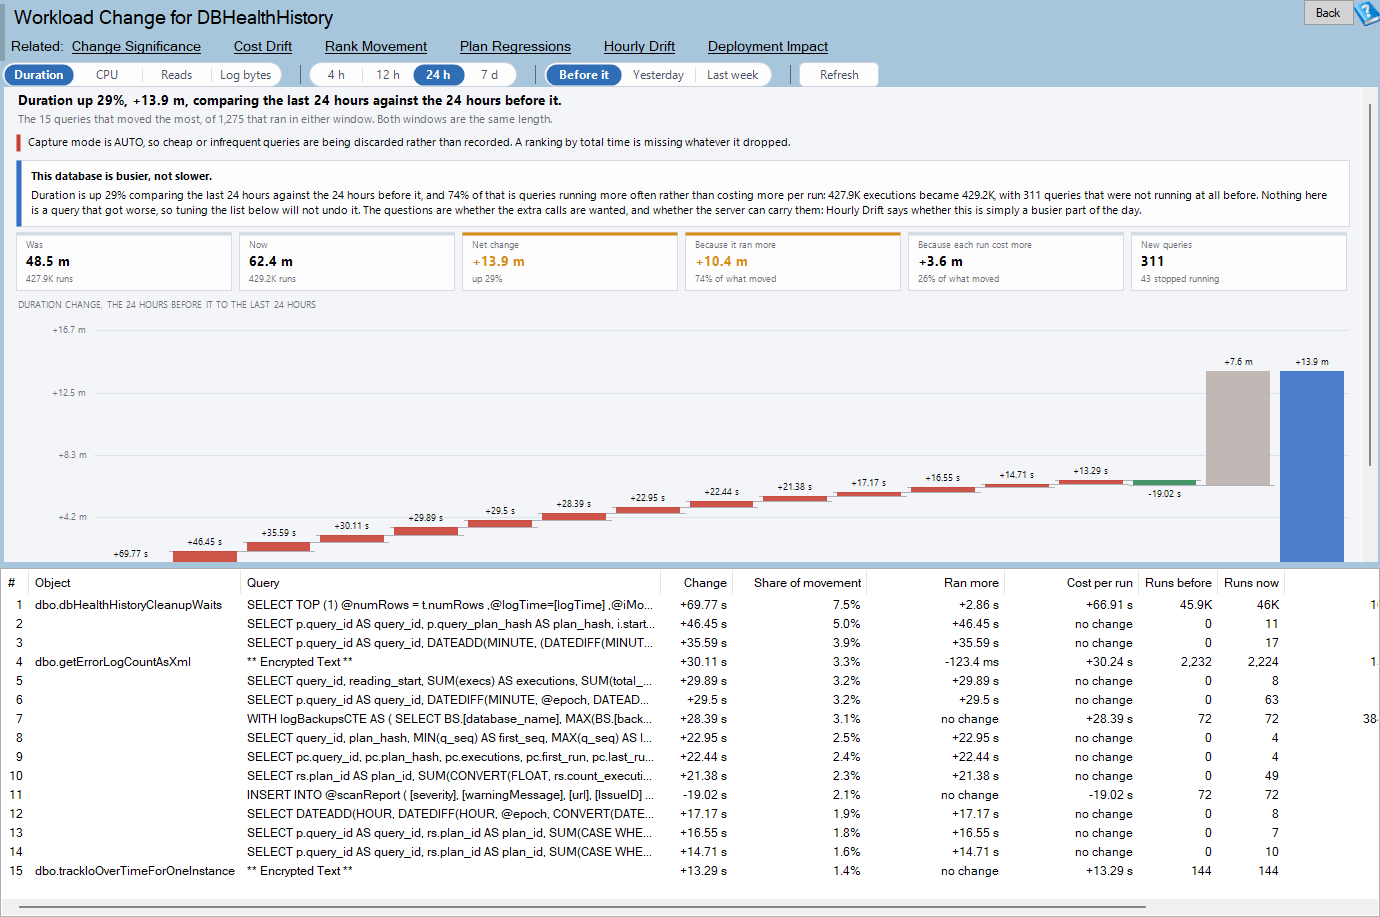
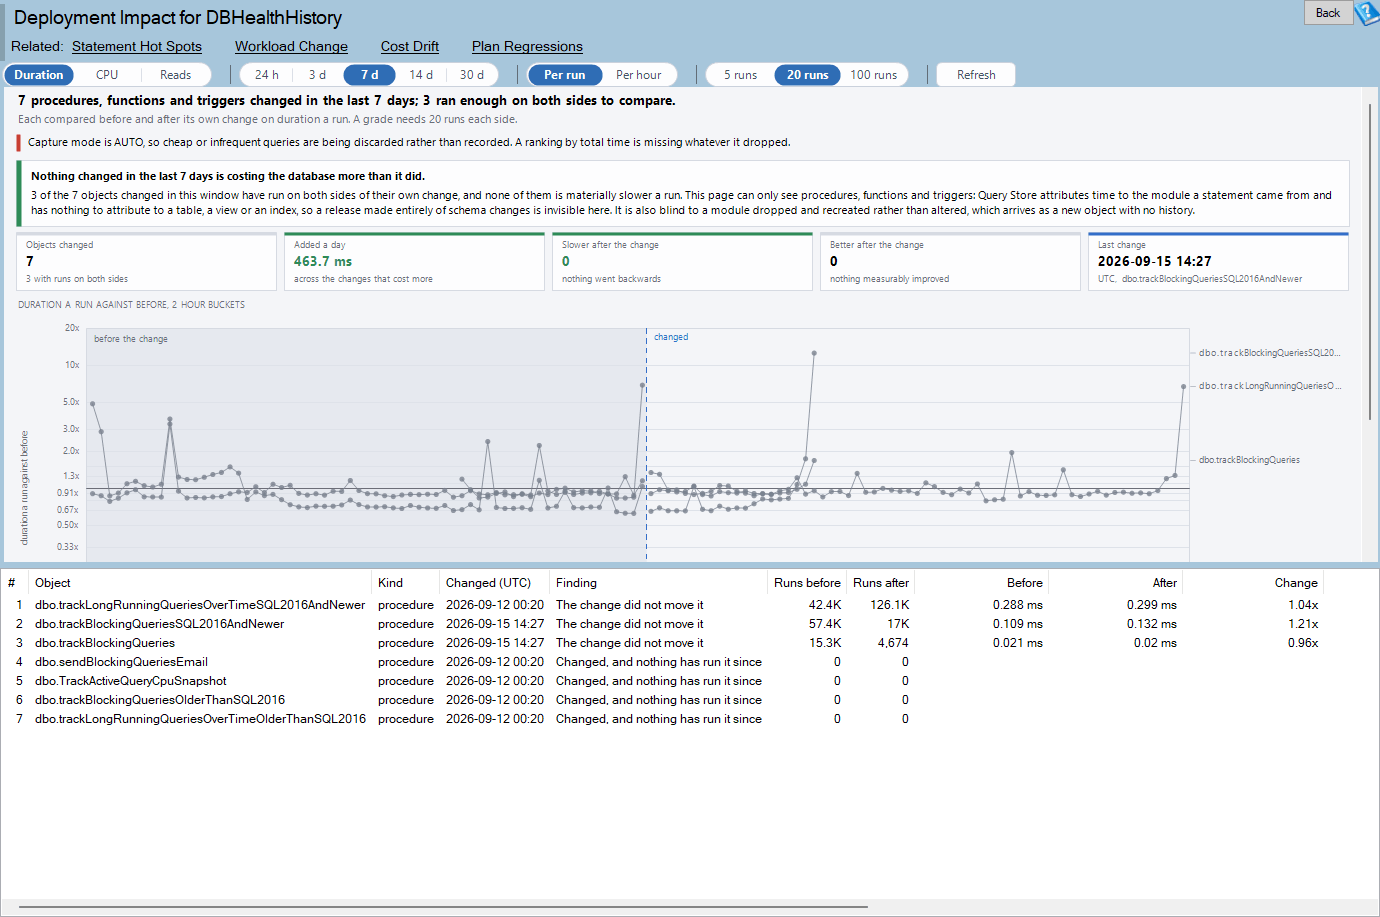
Some of the twenty five reports answer questions an engagement would otherwise spend a day building by hand from Query Store’s own tables. Cost Drift shows whether a query still costs what it used to per execution, and exactly when that changed. Deployment Impact does the same thing at the object level, showing what a procedure, function or trigger cost before and after its own change, which is the report a team wants open during a deployment window rather than found after one. Change Significance separates a genuine regression from a query’s own run to run variance, which is the step most ad hoc troubleshooting skips entirely, and the reason so many “it looks a little slower” investigations run in circles without ever reaching a conclusion.
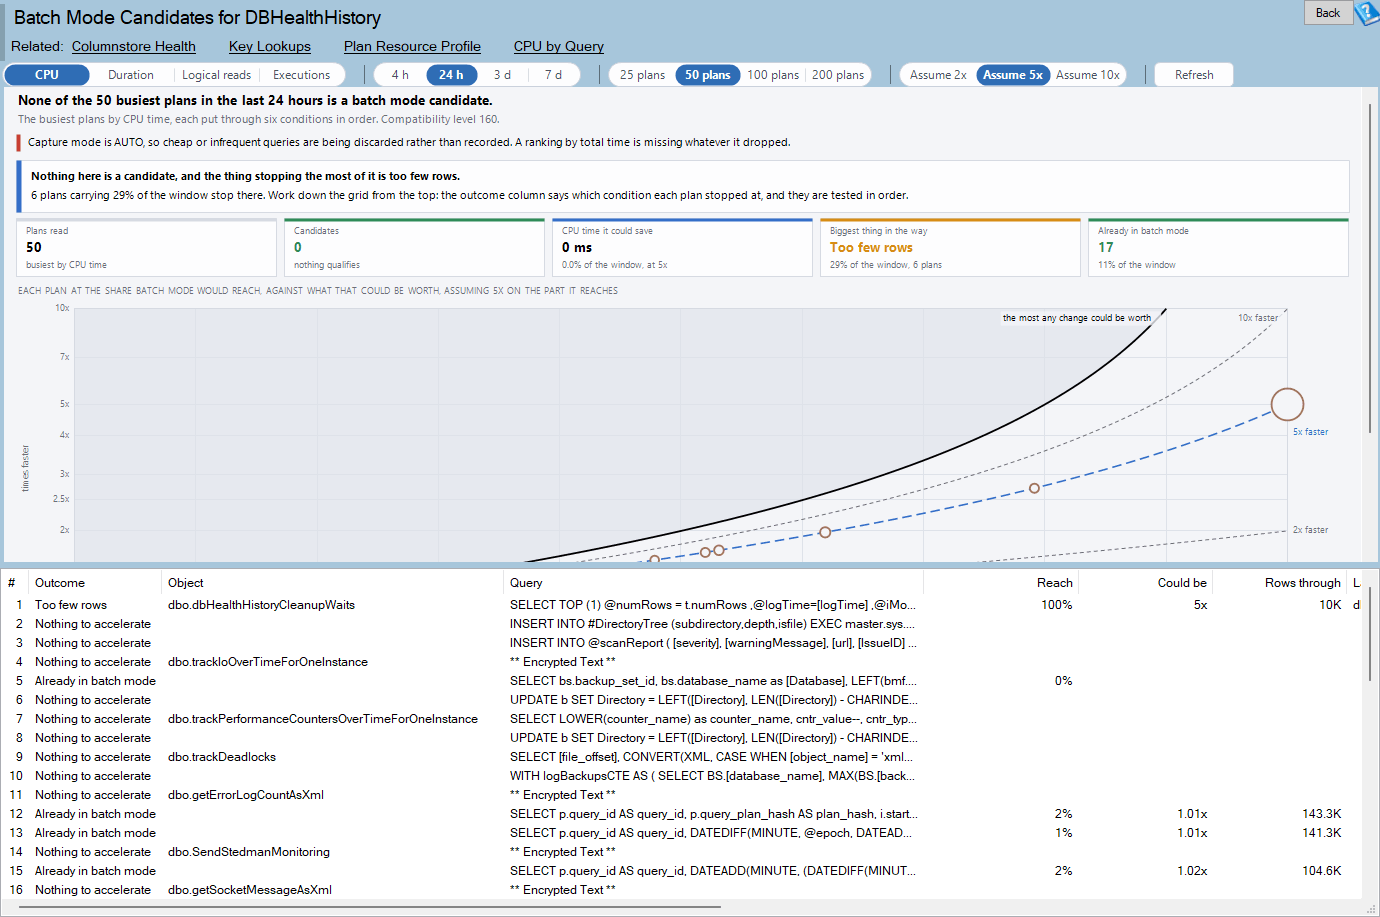
Others target the two things a busy Query Store has always hidden in plain sight. Key Lookups shows which indexes are sending the busiest plans back to the table, which columns they went back for, and what a covering index would remove, work that used to mean cross referencing an execution plan against the index usage statistics by hand, one query at a time. Batch Mode Candidates finds which busy queries are still running one row at a time and estimates what batch mode execution would actually be worth on each one, rather than leaving that as a guess a team makes before scheduling a compatibility level change.
Plan Survival, Query Feedback and Parameter Sensitive Plans matter most to anyone running SQL Server 2022, where the optimizer now corrects some of these problems on its own. Before this release, an engagement was often the only way a client found out the optimizer had quietly forced an old plan back, or split a statement’s plan by parameter value and gotten the split wrong on one side of it. Now the product reports that history on its own, with the evidence attached, rather than leaving it to be discovered during the next slow query investigation.
Fifteen reports for a reporting server nobody has looked at in years
SSRS servers have a habit of running for a decade with almost no attention, right up until a subscription silently stops firing and someone in finance asks where their Monday numbers went. The new suite treats that whole surface as inventory rather than as an afterthought: who published what, how each data source authenticates, which subscriptions have quietly stopped delivering, and the exact message each failed attempt left behind. SSRS Data Sources alone is worth having on a team standing up a new report server, because it flags every data source that cannot supply credentials unattended before the subscription that depends on it fails at three in the morning instead of during a business hours test run.
SSRS Never Run, SSRS Schedules and SSRS Subscriptions together answer the question a decommissioning project always starts with: what is actually being used, and what can be safely turned off. That question used to take a consultant a week of cross referencing execution logs, the job history behind each schedule, and a spreadsheet nobody fully trusted. Now it is three reports away, and SSRS Permissions closes the loop by showing every role assignment, every item that breaks inheritance from its folder, and every user who no longer has access to anything at all.
Twenty three reports for an Azure estate that never sits still
Azure SQL Health Monitor picked up twenty three reports this release, and the theme running through nearly all of them is that a platform as a service database hides its own accounting unless something goes looking for it. Compute Accounting and the Work No Query Explains answers the question every Azure bill eventually raises: how much of the processor time this database is being charged for belongs to no statement Query Store ever recorded. Workload Groups and What the Platform Runs Beside You splits that further, separating a client’s own queries from another database sharing the same elastic pool and from the platform’s own background work, which is the difference between blaming a query and correctly blaming a neighbor.
Serverless Billing and What Keeps the Meter Running matters to anyone who has ever had to explain an Azure invoice to a client, because the serverless tier bills on the highest of three separate rules, not simply on usage, and the report shows which rule was actually on top for each stretch of the billing period. Resize History and What Each Change Bought answers the question that usually only gets asked after the third resize this year: did the last change actually buy the workload anything, or did it just buy a bigger monthly invoice with the same complaints attached.
A few of these reports are built for the exact moment a client calls in a panic. Replica Lag and What Commits Wait For shows how far behind the primary each replica actually is, and how long writers were held back waiting on a replica that could not keep up, work that used to mean stitching together several dynamic management views against the clock by hand. Latch Contention and the Structures Behind LATCH Waits turns a LATCH_EX sitting at the top of a wait list into a named internal structure and a recognizable pattern, rather than leaving a consultant to guess which structure is actually contended and why. Elastic Pool Neighbors and Who Uses the Shared Allowance settles the argument that starts almost every elastic pool support call: who is actually using the room the pool is paying for, and whether two databases are using it at the same moment.
Features built for managing more servers than you can watch by hand
The new features in this release share a theme: knowing which server is on screen, and moving results out of the product and into whatever the rest of a team is already using to communicate.
Server types let every saved connection carry a tag, Production, Test, or whatever a team wants to call it, shown as a color chip in the server tree. That sounds small until a career has included at least one moment of being one keystroke away from running a fix against the wrong instance, and it now doubles as a filter, so a Test only view of a long connection list is one click rather than a squint at a list of names that all look alike at the end of a long day. Edit Connection lets a saved connection be changed in place instead of removed and re-added, which matters more than it should the first time a server gets renamed or moved to a new port. License and instance limit state is now shown in a dismissible strip rather than found out about later, and a server past the instance limit is no longer dropped from a list silently, which used to look exactly like a server that had simply stopped answering.
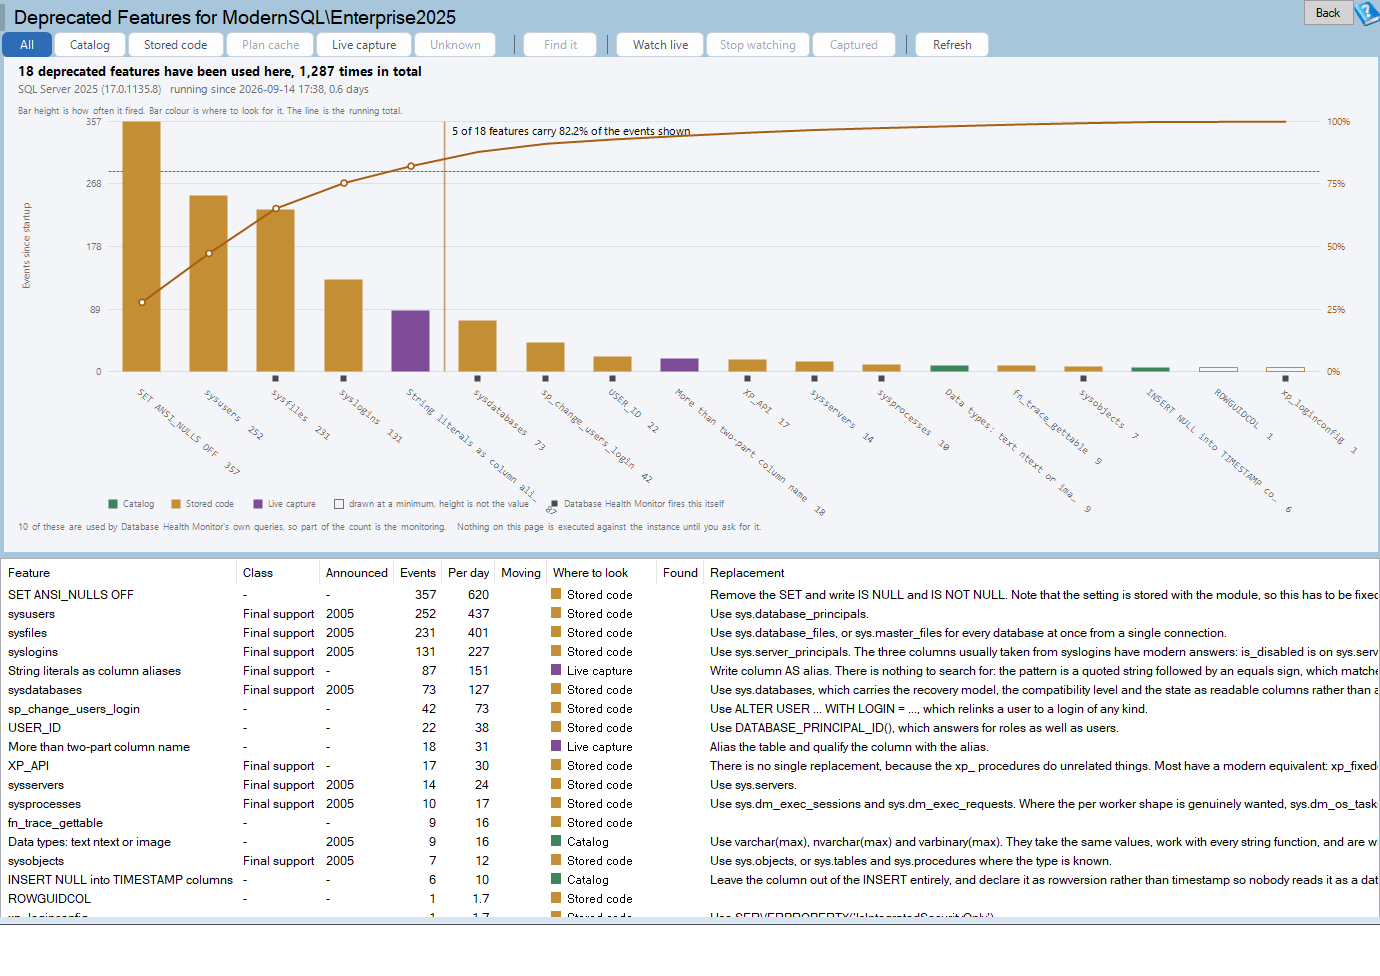
Export to files puts every grid, chart and page out as CSV, HTML or PNG, which matters more to a consulting practice than it might look at first glance. A finding that only lives inside a tool is a finding a client has to trust secondhand. A finding exported as a CSV and dropped straight into a deliverable, or a chart exported as a PNG and pasted into a report, is evidence a client can hold onto after the engagement ends. Remembered layout keeps the main window position, the navigation tree width, and the column layout of the key report grids between sessions, which sounds cosmetic until a team is switching between a dozen instances a day and re-arranging the same columns every single time.
The tray icon now reports on the health of the monitoring service itself, and notifies when monitoring fails or when SQL Server restarts on its own. A monitoring tool that goes quiet without telling anyone is worse than no monitoring tool at all, because silence from it reads exactly like good news right up until it is not. Run on other instances is the feature that most changes what fix actually means across an estate: a change that just succeeded on one server can now be run against every other connected instance, with a read only check first on each one that reports whether it already has the change, rather than running against all of them blind. For a team responsible for twenty instances that have all drifted slightly differently over the years, that turns a week of one off scripts into an afternoon.
Backup and restore: fewer scripts written by hand at the worst possible time
Backup and restore is where a consulting engagement has the least room for error, and this release spent real effort narrowing that room further. Backup Status now copies the complete restore sequence, with every file name included, so a runbook can be built by pasting rather than by retyping file names from a grid at two in the morning. Backup Advisor restores a striped backup with a single RESTORE statement rather than one per stripe, and takes new file locations to write the MOVE clauses automatically, which removes two of the most common places a hand typed restore script goes wrong under pressure.
Backup Time Frames now opens Backup Advisor directly for a selected backup, with the original restore script already attached, closing the gap between seeing a backup on a timeline and actually having a script to run against it. Log Viewer lists the log backups of the selected database directly, and Backup Status itself runs faster on instances carrying a large backup history, which matters on exactly the estates old enough to need a consultant in the first place. The Log Shipping report can now change the settings of an existing chain without tearing it down and setting it up again, and a right click surfaces the backup or restore history for the database behind it, which used to require opening two different tools to answer one question.
Quick Scan gets sharper about what it warns on
Quick Scan picked up new checks this release: a warning when the instance backup checksum default is not set to 1, a warning when Query Store is not enabled at all, and an offer to schedule the Ola Hallengren maintenance jobs directly from the check that flags their absence. The outdated build check now recognizes SQL Server 2025, so an estate running the newest release is not misread as running something unsupported. None of these are large individually, but a Quick Scan run is often the first thing a consultant does on a new engagement, and every check that turns a missed setting into a single line on a report is time that engagement does not spend rediscovering something the client’s own tooling should have caught months earlier.
The bug fixes that matter most when you do not want to bill for the same mistake twice
Silence
Quick Scan fix dialogs and the license key dialog both used to report success when the underlying change had actually failed, which is the worst kind of bug, because it looks exactly like nothing happened rather than looking like something went wrong. The email alert queue could drop an attachment without saying so, and could resend a message the mail server had already accepted, doubling a notification a team was already trying not to miss. Update All Historic Databases could report a history database that was unreachable, or simply stuck, as checked and up to date. Every one of those is a case where the tool told a team a job was done when it was not, and this release closes that gap in each place it was found, including overview panels that now stop and say a login lacks VIEW SERVER STATE instead of quietly re-running a query that login could never run in the first place.
Wrong answers measured on the wrong basis
Ages, uptime, recency and time windows were being measured on the workstation’s own clock instead of the server’s, across the index reports, connection pages, the msdb reports, SSRS and SSIS pages, the error log, server overview, memory ladder, CPU and IO by query, missing index reports, and three of the diagnostic tools. On a workstation in a different time zone from the server, or simply a few minutes out of sync with it, that turned how old is this backup into a wrong answer that still looked entirely plausible. Units and arithmetic followed the same pattern: total memory converted kilobytes to gigabytes using 1000 instead of 1024, IO by Hour overstated IO by the inverse of that same mistake, and Log Viewer’s compression ratio field showed exactly 100 percent regardless of the database’s actual compression. None of those failures look like bugs when a report is glanced at. They only look like bugs when someone checks the arithmetic by hand, which is exactly what an engagement is for.
Scripts that fail on the name, not the problem
Generated and executed scripts across Schema Drift, Problem Indexes, Columnstore, Partitioning, Quick Scan, VLF Advisor, Decryptionator and the report queries now double a closing bracket, quote with QUOTENAME, and pass names as parameters instead of splicing them directly into T-SQL. That single class of fix matters disproportionately to a consulting practice, because a script that fails on an object name with a bracket or an apostrophe in it fails on exactly the estate that already has enough irregular naming to need outside help, and it fails at the worst possible moment, mid script, rather than up front where it could be planned around.
Backup and restore correctness
Restore plans were over counting log backups when a differential applies, judging restorability from the newest full backup rather than the base full it actually needs, and taking a file check from a COPY_ONLY full that was never eligible to satisfy it. Backup Size was dropping COPY_ONLY backups from its accounting entirely, and Growth from Backups and Backup Speed were mixing in backups that had been restored onto the instance from somewhere else, treating a restore as though it were a backup taken locally. Every one of those is a scenario where the tool would have told a team a restore plan was sound when it was not, which is exactly the finding an engagement exists to catch before it becomes an incident rather than after.
What this means for the next engagement
None of this changes what a team already knows about their own environment. What it changes is how long it takes to find out something that is already true: which query actually got slower and when, which SSRS subscription quietly stopped delivering, whether a resize actually bought the workload anything, whether the restore plan a runbook depends on will actually work when it is run for real. A release this size, built almost entirely out of visibility rather than new dashboards to babysit, is worth the upgrade on its own merits. It is also worth reading the fix list at least once, because a few of those five hundred and fifteen items describe exactly the kind of wrong answer a past engagement might have quietly relied on without anyone noticing.