A job that finished by five every morning for a year now finishes at seven. Nobody touched the code. Nobody changed the schedule. The query that runs inside it just started taking longer, and it happened on its own, sometime between one Tuesday and the next, with no error and no alert to explain what changed in the query plan underneath it. By the time anyone notices, the slow version has already been running for days, quietly, inside a job nobody was watching that closely.
How do I see what changed in the query plan when a SQL Server query suddenly gets slower? Database Health Monitor's Plan Differences report shows what changed in the query plan by reading both showplan documents Query Store kept for a statement's two most recent plans, then lining up their operators lane by lane: a seek that became a scan, a new join type, or an added parallelism operator, in place of guessing from cost numbers.
Database Health Monitor's Plan Differences report exists for exactly this moment. Most people reach for cost percentages on the current plan first, or they pull wait stats from before and after and try to eyeball a difference between the two. Neither one says what actually moved. A cost percentage is the optimizer's own guess about the plan it already chose, not a measurement against the plan that ran before it, and that guess shifts every time statistics refresh, even when the plan's actual shape hasn't changed at all. Wait stats tell you the server got busier somewhere, not where inside the plan it happened, or why. What you actually want is the operator tree itself, read before and after, side by side, so the change stops being a guess and starts being a fact you can point at.
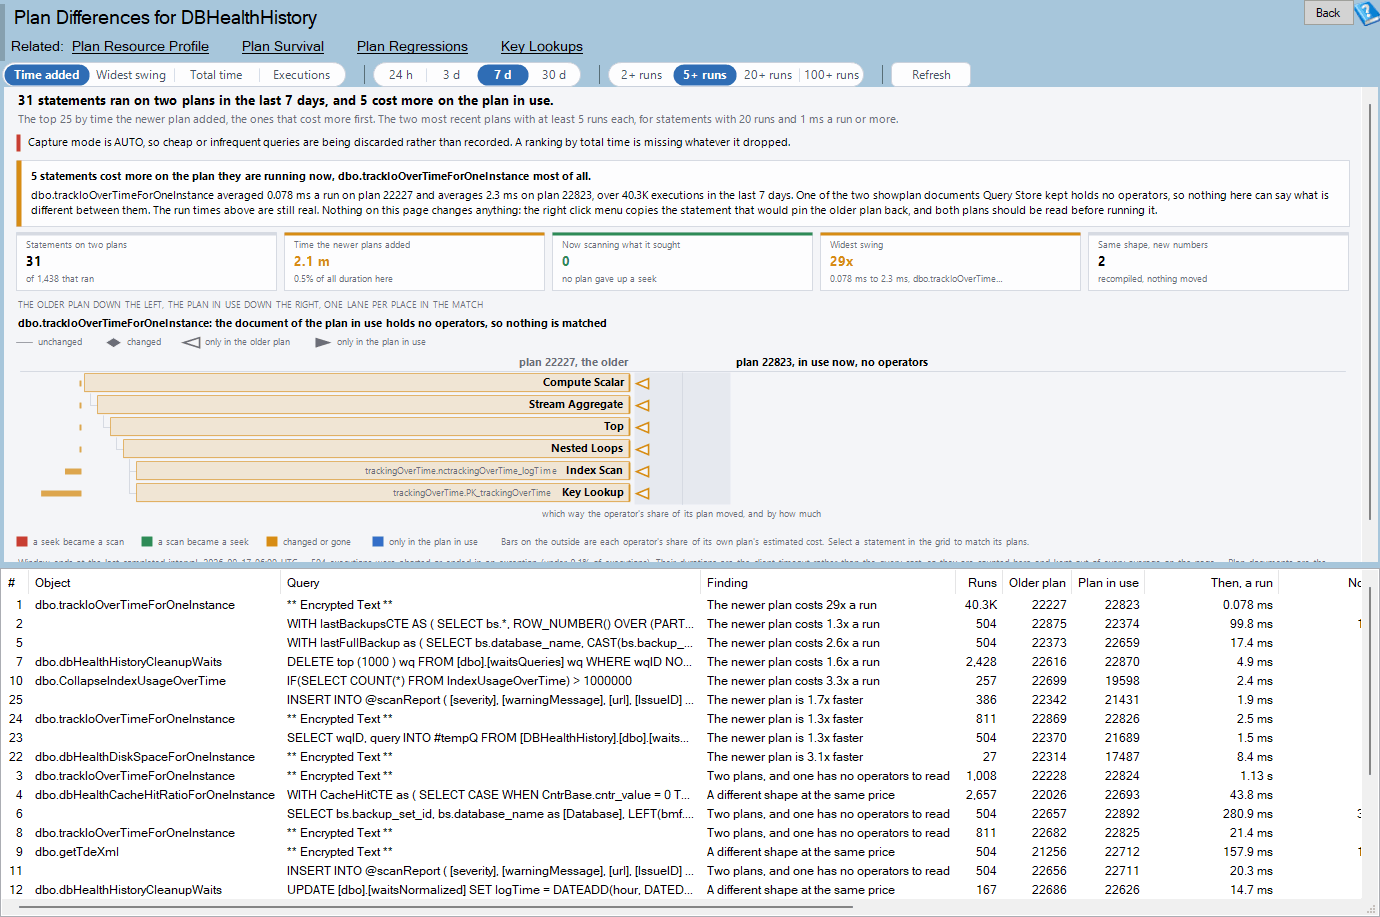
Plan Differences is one of the reports in Database Health Monitor. It runs against your own servers, and it takes about a minute to have this same screen open on one of them.
In this post
- The Number Everyone Reaches for First
- The Two Plans That Actually Matter
- What Changed in the Query Plan, Lane by Lane
- The Grid Behind the Chart
- What the Verdict Actually Says
- When to Force the Old Plan, and When Not To
- Where to Look Next
The Number Everyone Reaches for First
Two other reports already know a statement got slower. Plan Regressions ranks every statement by the time its plan change added, and lets you force the old plan back with one click if that turns out to be the right move. Plan Resource Profile goes further still: it says which resource the more expensive plan actually spends more of, CPU, reads, a memory grant, whichever one it turns out to be. Why Is One Execution Plan Slower Than Another? covers that resource breakdown in full, and it's worth reading on its own before you come back here. Both reports earn their keep on a busy server. Neither one reads the plan itself, though, and that's the gap Plan Differences fills. What they leave out is the operator tree: whether a seek turned into a scan, whether a hash join replaced a nested loop, whether a new parallelism operator showed up that wasn't there last month. A cost number moving is a symptom. An operator changing is the cause, and the cause is what you can actually fix.
The Two Plans That Actually Matter
Plan Differences doesn't hunt for the best plan a statement ever had, or the worst one it ever suffered through. It compares the two most recently used: the plan running now, called the plan in use, and the one that ran right before it, the older plan. That choice is deliberate. A plan that last ran eleven days ago isn't what changed this week, no matter how bad it was back then. The question this report answers is what changed, not what's theoretically possible across every plan a statement has ever had, and those are genuinely different questions with different answers. The toolbar lets you widen or narrow the window the two plans are pulled from, and raise or lower the floor a plan needs to clear before it counts at all.
- SQL Server 2016 or newer, since Query Store did not exist on any earlier version
- Query Store turned on for the database being examined, since the plan history lives inside it
- +VIEW DATABASE STATE+ on the login, to read the Query Store catalog views at all
- At least 5 regular executions in the window before a plan can count as one of the two compared, a floor set on the toolbar
- At least 20 executions of the statement itself, averaging 1 ms or more, before it gets ranked on the page
What Changed in the Query Plan, Lane by Lane
The chart draws the match itself. The older plan runs down the left. The plan in use runs down the right. Every operator gets its own lane connecting the two, and each lane says something different depending on what sits inside it. An operator with something on both sides of its lane sat in the same place in both plans; a diamond drawn in the middle of that lane means something about it changed anyway, even though the operator itself is still there. An operator with blank paper across from it exists in only one plan, and that blank is very often the finding you came looking for. The lane where a seek turned into a scan is drawn in red. A scan that turned into a seek, which is the direction you actually want, gets drawn in green, so the two directions never get confused at a glance across a busy chart.
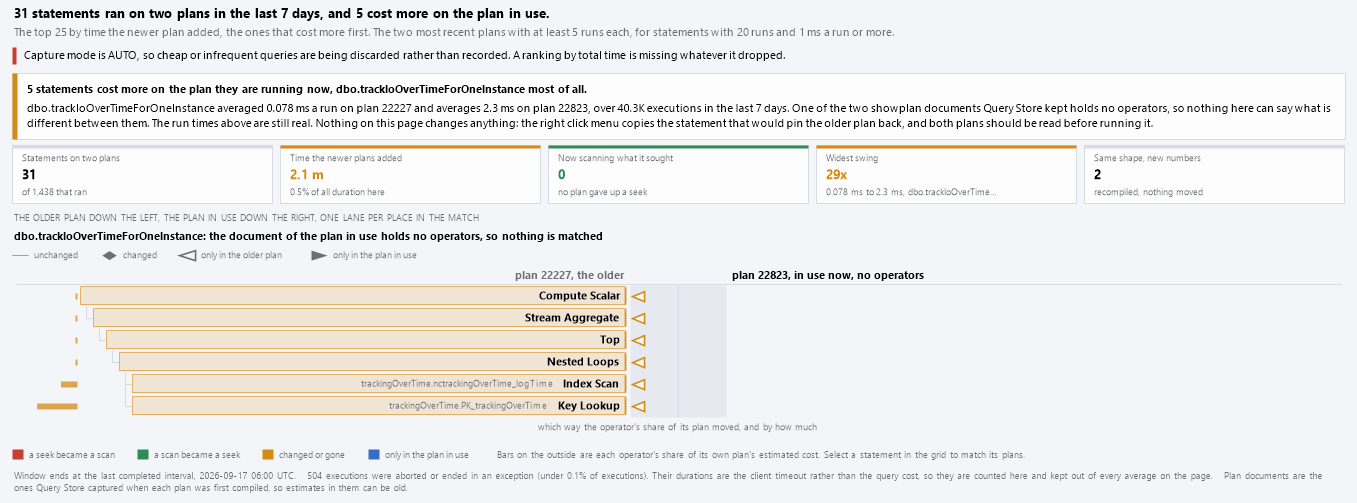
- A plain rail: the operator sat still, nothing about it changed
- A diamond: the same operator, in the same place, but something about it moved
- A hollow triangle pointing back: an operator that only the older plan has
- A solid triangle pointing forward: an operator that only the plan in use has
- A red tick: a warning sits on that operator, the kind a tempdb spill leaves behind
The short bar on each rail shows which way that operator's share of its plan's estimated cost moved. It's drawn on a log scale, so a doubling and a halving read as the same length in opposite directions, which keeps one huge swing from swallowing every smaller one on the page. A notch at the end of a bar means the swing ran past ten times in that direction. Hover any lane and you get both operators, their objects, their cost shares, and a plain sentence describing exactly what changed between them, no XML reading required, no second monitor needed.
The Grid Behind the Chart
Below the chart sits a grid of statements, ranked by whatever the toolbar is set to: time added, widest swing, total time, or executions. The default ordering puts the worst finding first. A seek that became a scan comes before a statement that simply costs more, which comes before the ones that got faster, which comes before everything else on the page. This page shows 25 statements, not 50, because every row here carries two full showplan documents, and that's already a lot of XML for the page to hold onto and keep readable. Hover a row for every column in full, including the ones a narrow window pushes off the right edge.

- Explain what changed: both plans, their run times, and every lane of the match, written out as plain text
- Show the statement: opens in the query window with the plan in use already attached for analysis
- Copy the script that forces the older plan: builds the +sp_query_store_force_plan+ call, with the unforce statement commented out right beneath it, copied but never run
- Copy either plan as showplan XML, to save as a .sqlplan file and open in SSMS directly
What the Verdict Actually Says
A line at the top of the chart names the single most expensive finding on the page, in plain words, before you've clicked on a single row.
dbo.Proc is scanning a table its older plan was seeking.
That sentence means the plan in use has a scan where the older plan had a seek, and it's costing at least a quarter more a run and a second more over the whole window it was measured against. It's the verdict that matters most on this page, because a seek turning into a scan is the one shape change that reliably costs real money, month after month, without anyone noticing until a batch runs long. Other statements on the page get quieter verdicts, and they're still worth reading before you close the tab.
| If the page says | What it means |
|---|---|
| N statements cost more on the plan they are running now | These plans cost more for some other reason than a seek turning into a scan |
| No statement is worse off on the plan it is running now | The plans differ, but nothing about the difference costs a thing |
| Every statement in this window ran on a single plan | There's nothing to compare yet; try a longer window or a lower floor |
When to Force the Old Plan, and When Not To
Nothing on this page changes the database. That includes the forcing script it writes for you: copying it costs nothing, but running it is a decision you make, not one the report makes on your behalf. Reach for the older plan when the two plans disagree only because of which parameter value each one got compiled against, since the underlying data never actually moved and the newer plan simply got unlucky on its first guess. Leave the older plan alone when the table has genuinely outgrown it, because forcing an old plan onto data it no longer fits just trades one problem for a slower one down the road. Read both plans before you decide which case you're actually looking at, since guessing here costs exactly as much as guessing did in the first place.
Where to Look Next
A seek that became a scan often traces back to a missing index, or to statistics that went stale after a big load came through overnight. A join type that changed often traces back to a parameter the plan was compiled for and never expected to see again. Plan Differences won't fix either one on its own. What it does is tell you which question to ask before an afternoon gets spent guessing at the wrong one. The full reference for the report, every column in the grid and every message it can show, lives in the Plan Differences documentation, worth bookmarking for the next time a plan changes shape without any warning at all.
What to check on your own server
- Widen the window past 24 hours if every statement shows only a single plan
- Confirm Query Store is turned on for the database before assuming there is nothing to compare
- Check that your login holds VIEW DATABASE STATE, or the catalog views return nothing
- Open the report and read the tile for statements now scanning what they used to seek first
- Read both plans before running any forcing script the report copies for you
Try Database Health Monitor Today
It replaces guessing from cost percentages with a lane-by-lane read of exactly which operator changed between a statement's two most recent plans. Database Health Monitor shows it on every instance you connect, in the time it takes to open the report.
Download Database Health Monitor and run the Plan Differences report against your own server. There is nothing to configure first, and you will know inside a few minutes whether it tells you something you did not already know.