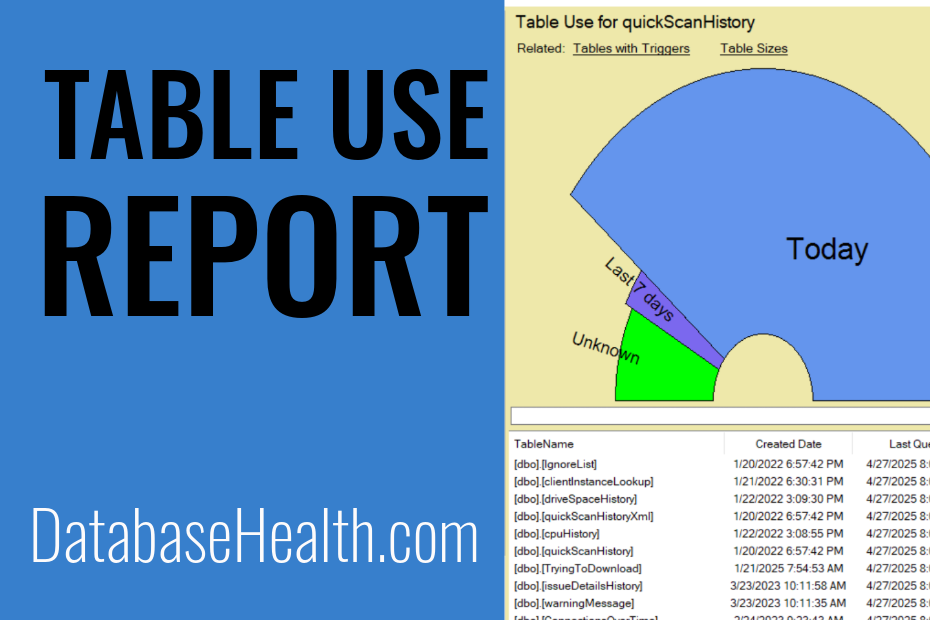
The Table Use Report in Database Health Monitor shows exactly how often each SQL Server table is queried, helping DBAs find active versus idle tables fast.
With this level of insight, teams can make smarter decisions around indexing priorities, data archiving, and security reviews without relying on guesswork. This post examines how the report surfaces usage patterns and turns that information into practical steps for improving performance and controlling database growth.
July is Database Health Monitor Month!
July has arrived, and it’s time to turn our attention to the heartbeat of our digital world – our databases! As the founder of Database Health and Stedman Solutions, I’m thrilled to proclaim this month as Database Health Monitor Month! This is our annual chance to celebrate the unsung heroes safeguarding our precious data and to explore the intricate web of data structures and relationships within our systems. Let’s take a closer look at their health, uncover hidden issues, boost performance, and ensure our data highways are running seamlessly. This July, let’s commit to not just keeping our databases operational, but ensuring they thrive at peak performance!
This month also marks the anniversary of Database Health Monitor. To celebrate, I’m excited to offer 25% off the licensing fee for the annual subscription to Database Health Monitor. Don’t miss this opportunity to enhance your database management!
What is the Table Use Report?
The Table Use Report tracks the last accessed time for each table in your SQL Server database. By showing when tables were last queried, it helps database administrators identify frequently used tables, detect unused ones, and make informed decisions that improve database efficiency. Whether you are tuning performance, cleaning up storage, or conducting security audits, this report is an essential tool.
Understanding the Report
The Table Use Report is organized into two clear sections for easy analysis:
Graphical Representation
The report begins with a fan chart that categorizes tables based on their last usage:
- Today (Blue) – Tables queried today.
- Last 7 Days (Purple) – Tables accessed within the last week.
- Unknown (Green) – Tables with no recorded query activity.
Detailed Table View
The second section is a grid that provides specific details for each table, including:
- Table Name – The name of the database table.
- Created Date – When the table was created.
- Last Queried – The last time the table was accessed.
- Range Used – The category indicating how recently the table was used (e.g., “Today”, “Last 7 days”, “Unknown”).
Use Cases for the Table Use Report
The insights from the Table Use Report can be applied in several ways:
- Performance Tuning: Identify frequently accessed tables to prioritize for indexing or partitioning.
- Database Cleanup: Detect unused tables that could be archived or deleted to free up space.
- Security Auditing: Verify that critical tables are actively used and spot any unusual activity.
- Storage Optimization: Reduce database size by compressing or removing rarely accessed data.
How to Interpret the Report
The report’s categories help you quickly assess table activity:
- Today: Tables marked as “Today” are actively in use.
- Yesterday: Tables accessed yesterday but not today.
- Last 7 Days: Tables used within the last week but before yesterday.
- Unknown: Tables with no recorded activity, which may be obsolete or unused. These warrant further investigation.
Note that SQL Server only tracks table usage since the last restart. If your server was recently rebooted or restarted, more tables may appear in the “Unknown” category.
Why Use the Table Use Report?
The Table Use Report in Database Health Monitor turns raw data into clear insights. It shows which tables drive SQL Server queries and I/O, plus which sit idle for weeks. Use it to optimize resources, cut storage costs, and boost performance while keeping your database lean and secure.
For example, you can quickly spot underutilized tables consuming unnecessary space or uncover forgotten data structures that may introduce security risks.Whether you are an experienced DBA overseeing enterprise databases or new to database management, this report simplifies ongoing maintenance and keeps your SQL Server running at peak efficiency.
Get Started with Database Health Monitor
Ready to unlock the power of the Table Use Report? Download Database Health Monitor today and start exploring your database’s activity. With its user-friendly interface and robust reporting, it’s the perfect tool to ensure your databases run smoothly and efficiently.
Check out this offer:Explore our Database Health Monitor special pricing.

Here are all the discounts for Database Health Monitor. Pick the one that fits your server count.
25% off 1 Instance – Code: 25OFF1
25% off 10 Instances – Code: JULY25
25% off 20 Instances – Code: 25OFF20 – Best Value
Free SQL Server Replication Course
Start Database Health Monitor Month with one of our most valuable training offers. Purchase a new one-year subscription to Database Health Monitor between July 1st and July 7th and receive our SQL Server Replication Course absolutely free. This comprehensive course covers snapshot, transactional, and merge replication, helping you better understand, manage, and troubleshoot replication environments. Whether you are maintaining existing replication or planning a new deployment, this course provides practical, real-world knowledge that can save hours of frustration. A $499.99 value included at no additional cost.